Dashboard
The cmercury dashboard is designed to give you a comprehensive and intuitive view of your email marketing efforts. With key insights into your activity, audience growth, performance metrics, and trends over time, the dashboard equips you with the information needed to optimize your campaigns. Whether you’re tracking engagement, analyzing delivery rates, or monitoring unsubscribes, the flexible tools and visual graphs allow you to make informed decisions and drive better results. Leverage the power of these insights to continuously improve and refine your email marketing strategy.

Activity Overview
Track your email activity at a glance with a breakdown of total emails sent, campaigns targeted, and lists used in the past 30 days.
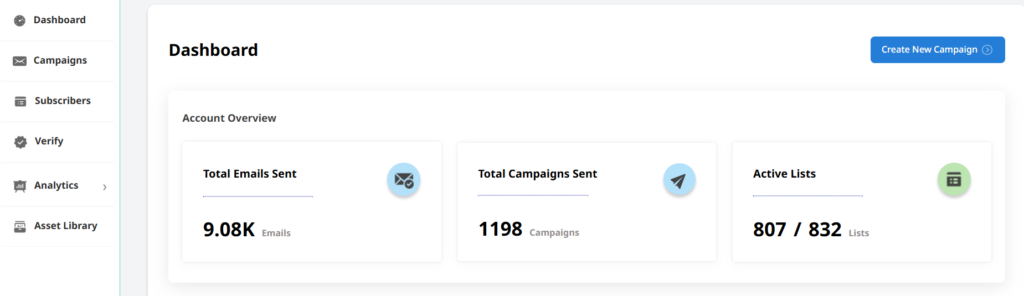
Emails Sent: The cumulative number of emails sent from your account since signup.
Campaigns Deployed: Total Campaigns Deployed refers to the total number of campaigns sent since signup.
Active Email Lists : Active List refers to the number of lists targeted in the last 30 days, compared to the total number of lists created. This includes both full lists and any segments within them that were engaged during this period.
Audience Overview
Audience overview gives you a quick view of your subscriber growth over time, helping you track engagement and trends.

Total Subscribers: Displays the total number of active subscribers since signup.
Recent Subscribers: Shows the count of new subscribers who have joined in the last 30 days.
Subscribers Today: Highlights the number of new subscribers who signed up today.
Performance Overview
The Performance Overview offers a snapshot of your email campaign’s success, highlighting key metrics like delivery rates, open rates, click rates, and unsubscribes. It can be viewed for the past 7, 30, or 90 days, providing a comprehensive view of subscriber engagement across your email campaigns.

Delivered: Displays the number of emails successfully delivered to recipients’ inboxes (Delivered = Sent – Bounces)
Opened: Displays the count of total emails opened (including unique and multiple opens by the recipient)
Clicked: Displays the count of total clicks (including unique & multiple clicks by the recipient).
Unsubscribed: The number of recipients who opted out or unsubscribed from future emails.
Performance over time
The Performance Over Time graph provides a visual representation of your campaign’s performance, including key metrics like delivery rate, open rate, click rate, and unsubscribe rate. This allows you to track trends and monitor the effectiveness of your campaigns over time. You can also selectively view specific metrics by toggling the enable/disable options for each item (e.g., delivery, open rate, etc.), giving you the flexibility to focus on the data that matters most to you.

The cmercury dashboard provides an overview of your campaign performance and audience growth, offering a bird’s-eye view of both engagement and progress. With all the key metrics in one place, it helps you stay informed and make decisions that drive better results.


